
August 7 Tariffs, Treasury Yields, and Tactical Timing: What Smart Multifamily Investors Are Watching
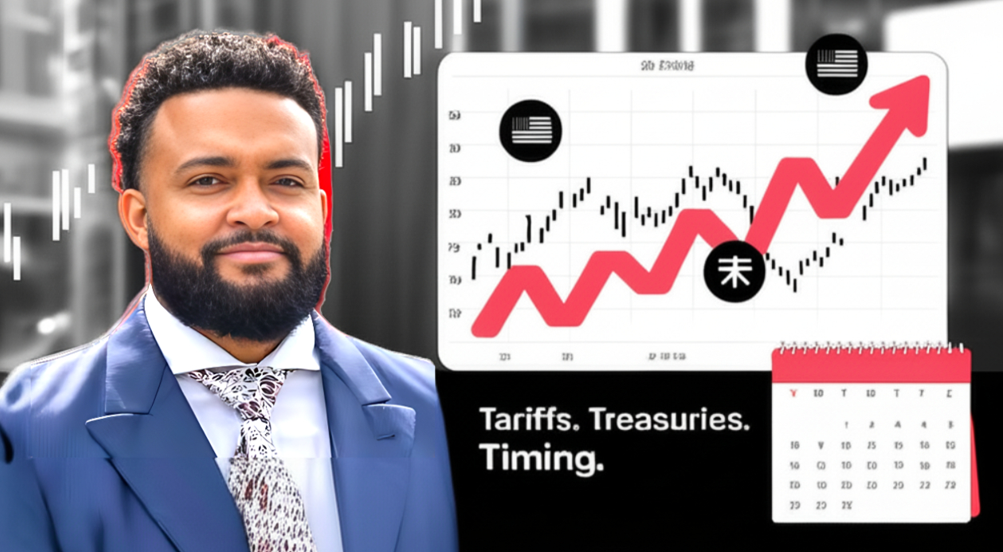
As we approach August 7, there's a critical shift happening beneath the surface of the capital markets—one that savvy real estate investors, especially those focused on long-term asset preservation and yield, can’t afford to ignore.
Originally set for early April, the implementation of President Trump’s reciprocal tariffs has now been delayed multiple times—April 2, April 9, July 9, August 1—and now, August 7.
While it may sound like political noise, the signal for investors is clear: bond markets are calling the shots, and the 30-year Treasury yield is the line in the sand.
Why the 30-Year Treasury Yield Is the Silent Power Broker
Every delay in the tariffs thus far has correlated with increased volatility in the 30-year Treasury yield—a critical indicator of long-term investor sentiment and one of the few rates the Federal Reserve has limited control over.
Why does that matter?
Because if the yield spikes, institutional capital tightens, equities react sharply, and policymakers hit pause. That’s exactly what we saw in April.
But if yields remain stable, the tariff clock moves forward—and inflation risk increases across asset classes.
Two Likely Scenarios for Investors
Let’s break this into clear outcomes with actionable takeaways:
✅ Scenario 1: Treasury Yield Spikes
This could trigger a short-term pullback across equities, crypto, and even precious metals. For those of us focused on multifamily in Virginia, this type of volatility often opens a window where motivated sellers surface, capital gets cautious, and cap rate expansion creates opportunity.
➡️ My move: If yields spike, I’ll position more aggressively—seeking value-add opportunities and potentially distressed pricing in Q4.
🕰 Scenario 2: Yield Remains Stable, But Stocks Pull Back Anyway
This indicates softening sentiment but no real shift in debt markets. In this case, patient capital wins. Rather than chasing trades, I’ll continue my current strategy of disciplined underwriting and targeted acquisition in secondary Virginia markets with stable fundamentals.
➡️ My move: Stay consistent, continue to dollar-cost average into high-quality assets with favorable debt structures.
The Real Cost of Tariffs: Inflation, Consumption Taxes, and the Dollar’s Decline
In June, the U.S. government collected $26.6 billion in tariff revenue—a record-breaking figure. But in context, it's a fraction of the government’s $580 billion monthly spend.
These tariffs function as consumption taxes on U.S. businesses and households, and the effects are starting to show:
- Retailers are now adjusting pricing in tandem
- CPI inflation is expected to rise in August and September
- Goods inflation will outpace wage growth for most of the consumer economy
And for long-term investors? Tariffs weaponize the U.S. dollar—accelerating de-dollarization and putting more pressure on the Fed to manage inflation without further damaging demand.
What This Means for Multifamily Investors in Virginia
The thesis is simple:
- Inflation is sticky
- Dollar strength is weakening (against real assets, not fiat currencies)
- Bond markets are the early warning system
- Multifamily remains one of the few scalable, inflation-hedged, yield-generating asset classes available
In short: volatility in the public markets often creates clarity in the private ones. That’s where we play.
How I’m Positioning Right Now
Heading into August 7:
- 📉 If the yield spikes and markets correct – I’m actively sourcing undervalued assets and may deploy capital more aggressively.
- 📊 If the yield holds and volatility rises anyway – I remain disciplined, underwriting with precision and favoring operators with strong debt service coverage.
- 🧭 If markets climb – I monitor closely but avoid chasing. This is a cycle of patience and preparation.
Final Thought: Real Assets Over Headlines
Don’t let political theater distract you from the fundamentals. The bond market is the signal. Tariffs are the catalyst. And for investors who understand timing, capital efficiency, and market structure—this moment may create once-a-year opportunities.
If you’re looking to explore multifamily investment opportunities in Virginia—particularly 50+ unit assets with long-term yield potential—let’s have a conversation.
📩 Contact me here or connect with me on LinkedIn to explore what’s coming next.


Justin Ferguson is a Multifamily Specialist in Marcus & Millichap's Southern Virginia Office. He prides himself in helping corporate professionals, private investors, REITS, developers, and syndicators strategize and maximize their returns to grow their portfolios at faster, more efficient rates.